The structural characterization of nanoparticles (NPs) and nanomaterials.


The traditional scheme of the description and the characterization of substances contains two components:
(i) list of chemical elements involved in a molecule;
and (ii) adjacency Matrix which represents covalent bonds between the chemical elements.
This information can be used to calculation of various molecular descriptors, such as, topological indices, 3D characteristics extracted from a model of molecular mechanics (distances between atoms, valent and torsion angles), and quantum mechanics descriptors (electron density distribution).
In the case of traditional substances quantitative structure – activity relationships (QSAR) give possibility to estimate gaps in available experimental data for various endpoints according to the scheme:


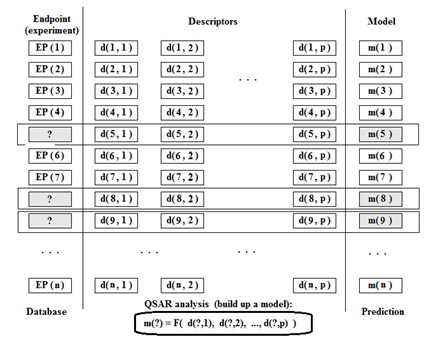
In other words QSAR paradigm for the traditional substances can be represented as the following:

Endpoint = F ( Molecular Structure )

  The description and characterization of nanoparticles by traditional scheme is limited, because
(i) the molecular architecture of nanoparticles is extremely large and extremely complex;
(ii) there are specific interactions between different parts of the nanosystems which cannot be represented topologically
and / or by means of molecular mechanics and quantum mechanics.
The quantity turns into quality: the above paradigm for nanomaterials becomes unacceptable.
Under such circumstances, representation and characterization of nanomaterials should be organized by untraditional manner.
We have used the following principles of description and characterization of nanomaterials to build up model for endpoint related to nanomaterials.
1. Endpoint is any physicochemical or biochemical parameter of nanomaterials, that is (i) available for a group of similar nanomaterials; and (ii) that is useful information from practical point of view.
2. The paradigm of building up a model is the following:

Endpoint = F ( Available Information )

Available information can be
(i) data on chemical composition of a nanomaterial;
(ii) technological parameters related to the nanomaterial;
(iii) information related to synthesis of the nanometrial;
(iv) size;
(v) dose or concentration;
(vi) irradiation or dark;
(vii) dzetta potentials; etc.
In other words, we are using all available information on some group of nanomaterials.
3. A selected list of characteristics of nanomaterials should provide possibility to define the domain of applicability for a model. In other words, characteristics selected as the basis of description of nanomaterials should have satisfactory prevalence in both the training set and the test set.
Examples of the developed systems of characterization of nanomaterials are the following:
(i)Modeling of nanoparticles uptake in PaCa2 cancer cells [1];
(ii)Modeling of anti-HIV activity of fullerence derivatives [2].
Thus, we have suggested original principles of the description and characterization of nanomaterials.

References:
[1] Toropov A A, Toropova A P, Puzyn T, Benfenati E, Gini G, Leszczynska D, Leszczynksy J. QSAR as a random event: Models for nanoparticles uptake in PaCa2 cancer cells. Chemosphere 2013; 92 : 31-37.
[2] Toropov A A, Toropova A P, Raska I Jr, Benfenati E, Gini G. Development of QSAR models for predicting anti-HIV-1 activity using the Monte Carlo method . Central European Journal Chemistry 2013 ; 11 : 371-380.

A format for the representation of the NPs structure.

The representation of nanomaterials in standardized form is an object of research work. However, most probably the standardization will give clear transparent results (databases) in the future.
A possible way to organize a model for endpoints related to nanomaterials in the present time can be expressed in the form: endpoint is a mathematical function of all available eclectic information.
The eclectic information can be
(i)atom compositions;
(ii)conditions of synthesis;
(iii) the features of nanomaterials related to their manufacturing.
Naturally, the list can be easily extended (size, porosity, symmetry, electromechanical properties etc.).
In fact, the main task related to predictive modeling of nanomaterials can be defined as the following: the establishing of an optimal method to get a preferable results:
(i) quality of the nanomaterials;
and / or
(ii) list of perspective candidates for a technical and / or for a biochemical role, by means of the preliminary analysis of available experimental data including description of different ways of the performance of the experiment.
Thus, in order to define a predictive model for endpoint related to nanomaterials, one should exchange the paradigm of

Endpoint = F(molecular structure)

by the paradigm of

Endpoint = F(eclectic information)

In praxis, the approach can be demonstrated with model of thermal conductivity of micro-electronic-mechanic-systems (MEMS), where chemical composition, temperature, and technological attributes of MEMS are involved to build up the model.
The model has been calculated using developed by us the CORAL software (http://www.insilico.eu/coral). Table 1 shows the codes of technological attributes of MEMS.


Table 1.
Technological attributes and their codes, which are using for building up model of thermal conductivity for MEMS.

Temperature, C

Code of the temperature

20

 %1

25 

 %1

27

 %1

80

 %1

100

 %1

127         

 %1

150

 %1

200   

 %2

250

 %2

273.1

 %2

315  

 %3

350

 %3

400

 %4

425

 %4

500

 %5

540

 %5

600

 %6

650

 %6

700

 %7

800  

 %8

875

 %9

1000

 %10

1100

 %11

1200 

 %12

1250

 %12

1327

 %13

1400

 %14

1530

 %15

1600

 %16

2300

 %17

Status of MEMS

Code of status

Ceramic

1

Single crystal

2

Cubic

3

CVD*

4

Glass

5


*) CVD = Chemical Vapor Deposition

Table 2 contains representation of MEMS together with three different distribution of data into the training and validation sets. The predictive models for MEMS is calculated with the correlation weights for technological attributes CW(Codek). The numerical data on the correlation weights were calculated with the Monte Carlo technique provided by the CORAL software described in work [1].
The approach is based on structured training set (the set united the sub-training, calibration, and test sets) and external validation set. Optimal descriptors for MEMS are calculated as the following

DCW(T, Nepoch) = ∑ CW(Codek)

T and Nepoch  are parameters of the Monte Carlo optimization: T is threshold, i.e. coefficient for distribution of all codes into two classes
(i) rare;
and (ii) active (only active codes are involved in build up the model).
Nepoch is the number of epoch of the Monte Carlo optimization.
Thus, we have suggested an approach for predictive modeling of endpoints related to nanomaterials, based on the described system of representation of nanomaterials.


Table 2.
MEMS, their codes and data on the decimal logarithm of thermal conductivity , as well three splits of available data into the sub-training set (+), calibration set (-), test set (#), and validation set (*).


MEMS

Split

Codes for MEMS

lgTC


1

2

3


AlN-1

+

+

+

Al.N.%6

1.302

AlN-2

*

-

*

Al.N.%4

1.345

AlN-3

-

+

+

Al.N.%1

1.479

Al2O3-1

#

-

-

Al.Al.O.O.O.2

1.699

Al2O3-2

+

+

*

Al.Al.O.O.O.1.%14

0.735

Al2O3-3

-

-

+

Al.Al.O.O.O.1.%1

1.399

Al2O3-4

-

*

#

Al.Al.O.O.O.1.%3

1.189

Al2O3-5

*

*

+

Al.Al.O.O.O.1.%5

1.165

Al2O3-6

+

#

#

Al.Al.O.O.O.2.%1

1.634

Al2O3-7

*

#

+

Al.Al.O.O.O.2.%3

1.293

Al2O3-8

*

+

-

Al.Al.O.O.O.2.%8

1.084

BN-1

*

#

*

B.N.1.%3

1.458

BN-2

-

#

*

B.N.1.%7

1.431

BN-3

*

-

+

B.N.1.%10

1.425

Cd

-

+

-

Cd.%1

1.986

Cr

+

-

+

Cr.%1

1.956

CrB2

-

#

-

Cr.B.B.%1

1.311

Cr3C3

-

+

-

Cr.Cr.Cr.C.C.C.1

2.278

GaAs

+

+

+

Ga.As.%1

1.663

Mo

-

+

*

Mo.%1

2.140

MoSi2-1

#

*

-

Mo.Si.Si.%1.1

1.732

MoSi2-2

#

+

#

Mo.Si.Si.%4.1

1.490

MoSi2-3

#

-

#

Mo.Si.Si.%5.1

1.345

MoSi2-4

-

#

+

Mo.Si.Si.%6.1

1.377

MoSi2-5

#

-

-

Mo.Si.Si.%9.1

1.284

MoSi2-6

+

*

#

Mo.Si.Si.%11.1

1.234

(Al2O3)3*(SiO2)2-1

+

*

+

Al.Al.O.O.O.Al.Al.O.O.O.Al.Al.O.O.O.Si.O.O.Si.O.O.%1.1

0.782

(Al2O3)3*(SiO2)2-2

#

#

#

Al.Al.O.O.O.Al.Al.O.O.O.Al.Al.O.O.O.Si.O.O.Si.O.O.%2.1

0.735

(Al2O3)3*(SiO2)2-3

-

*

*

Al.Al.O.O.O.Al.Al.O.O.O.Al.Al.O.O.O.Si.O.O.Si.O.O.%4.1

0.663

(Al2O3)3*(SiO2)2-4

+

#

-

Al.Al.O.O.O.Al.Al.O.O.O.Al.Al.O.O.O.Si.O.O.Si.O.O.%6.1

0.621

(Al2O3)3*(SiO2)2-5

*

-

+

Al.Al.O.O.O.Al.Al.O.O.O.Al.Al.O.O.O.Si.O.O.Si.O.O.%8.1

0.599

(Al2O3)3*(SiO2)2-6

#

*

*

Al.Al.O.O.O.Al.Al.O.O.O.Al.Al.O.O.O.Si.O.O.Si.O.O.%10.1

0.575

(Al2O3)3*(SiO2)2-7

*

#

*

Al.Al.O.O.O.Al.Al.O.O.O.Al.Al.O.O.O.Si.O.O.Si.O.O.%12.1

0.575

(Al2O3)3*(SiO2)2-8

-

+

*

Al.Al.O.O.O.Al.Al.O.O.O.Al.Al.O.O.O.Si.O.O.Si.O.O.%14.1

0.575

Ni

*

+

#

Ni.%1

1.957

Pt

#

+

-

Pt.%1

1.863

SiC-1

*

-

+

Si.C.3.4.%1

2.082

SiC-2

+

#

#

Si.C.3.4.%6

1.319

SiC-3

-

#

*

Si.C.3.4.%8

1.407

SiC-4

-

-

#

Si.C.3.4.%10

1.329

SiC-5

#

-

#

Si.C.3.4.%13

1.539

SiO2-1

-

*

*

Si.O.O.1.%2

0.017

SiO2-2

+

*

-

Si.O.O.1.%4

0.097

SiO2-3

#

-

#

Si.O.O.1.%8

0.223

SiO2-4

#

#

-

Si.O.O.1.%12

0.320

SiO2-5

#

+

*

Si.O.O.1.%16

0.400

SiO2-6

*

-

+

Si.O.O.5.%1

0.140

SiO2-7

*

*

-

Si.O.O.5.%2

0.107

SiO2-8

+

#

-

Si.O.O.5.%3

0.134

SiO2-9

#

*

#

Si.O.O.5.%4

0.176

SiO2-10

*

#

+

Si.O.O.5.%7

0.255


References:
[1] A.P. Toropova, A.A. Toropov, T. Puzyn, E. Benfenati, D. Leszczynska, J. Leszczynski, Optimal descriptor as a translator of eclectic information into the prediction of thermal conductivity of Micro-Electro-Mechanical Systems J. Math. Chem. 2013; 51: 2230-2237